Open benchmarks for scientific machine learning
FluidsBench
Evaluate the accuracy and generalisation of AI surrogate models across fluid dynamics datasets.
Shared test splits, reference evaluation tools and published metrics support systematic comparison of model performance.
Contribute to the first benchmark release.
Submissions open for 5 datasets.
Realistic fluid dynamicsFrom airfoils and vehicles to aircraft and turbomachinery.
Physical performance metricsCompare field errors, forces and flow profiles.
Traceable evaluationTrace the model, evaluation rules and submitted data.
Benchmark results
Leaderboard and model comparison
Compare models within a dataset and test split using overall scores, individual error metrics and reference flow profiles. The DrivAerML illustration below uses the published scoring structure.
| Model | Overall | Fields | Forces | Profiles |
|---|---|---|---|---|
| 1 Example A | 86.5 | 84 | 90 | 88 |
| 2 Example B | 84.0 | 90 | 80 | 76 |
| 3 Example C | 80.5 | 78 | 84 | 82 |
Component-level comparison. Example B has the highest field score, while Example A has the highest overall score through higher force and profile scores.
DrivAerML: 50% fields + 25% forces + 25% profiles. Group scores are normalised weighted means of the corresponding component scores.
Spatially resolved assessment. Profile comparisons identify local deviations from CFD reference data that may be obscured by aggregate metrics.
Schematic velocity profiles; no physical values are represented. DrivAerML scores 16 fixed velocity lines and four fixed Cp cuts.
Illustration only. These fictional models, scores and curves are not submissions or benchmark results.
Field accuracy
Relative L2 errors in surface pressure (15%), wall shear (10%), volume velocity (15%) and volume pressure (10%).
Field metric definitions →Integrated forces and moments
R² for drag (15%), lift (5%) and pitching moment (5%), computed from the predicted surface fields.
Force and moment definitions →Flow profiles
R² for fixed velocity profiles (15%) and fixed Cp cuts (10%). Geometry-relative profiles are diagnostic and carry no scoring weight.
Profile metric definitions →Preview the leaderboard Explore the full interface and methodology before results are published.
A common basis for comparison
Consistent evaluation and scoring
Reported errors depend on the test split, spatial sampling, normalisation and aggregation procedure. FluidsBench specifies these choices for each benchmark to support reproducible evaluation and meaningful comparisons between models.
Common test conditions
Models are evaluated on the same required cases and locations within a dataset and split, even when they use different meshes or representations.
Complementary physical quantities
Where supported, fields, integrated forces and flow profiles test complementary aspects of the physics. Each dataset publishes its metrics, weights and score calculation.
Aggregate and component metrics
The overall score summarises performance under the published weighting. Individual metrics and profile comparisons expose differences in field accuracy, integrated quantities and local flow structure.
Benchmark datasets
Datasets and evaluation tasks
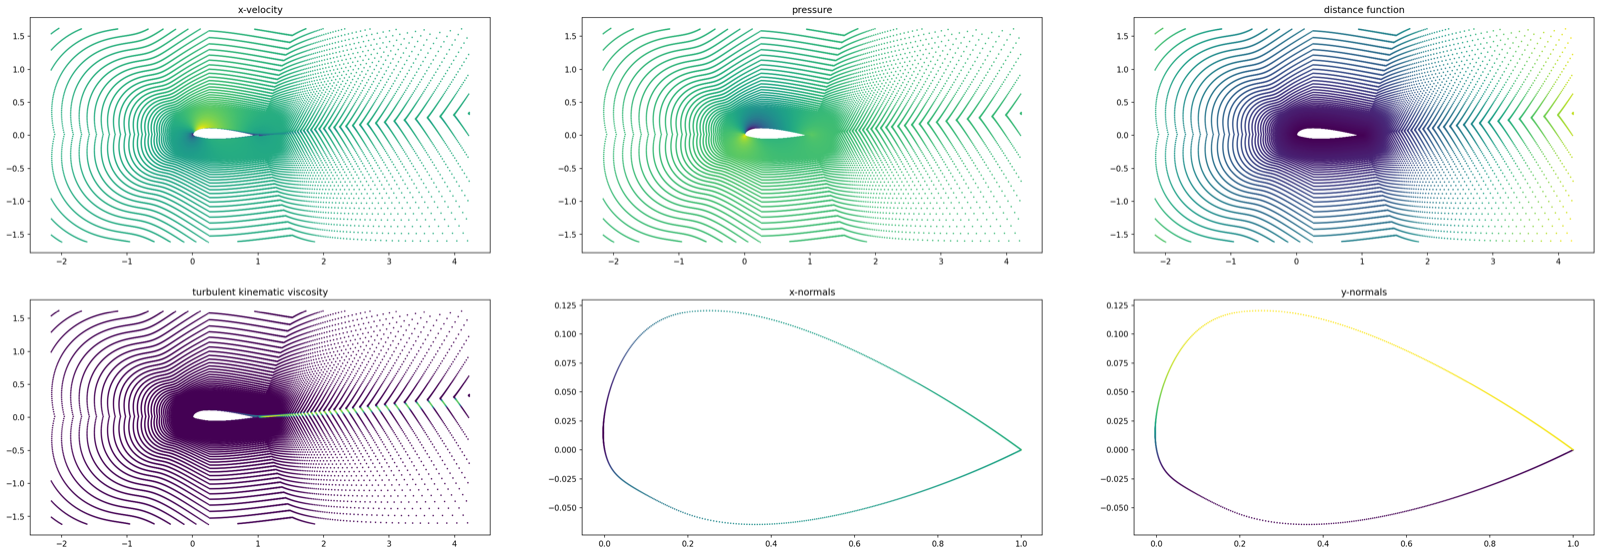
AirfRANS
Open for submissionsDataset, test splits and evaluation metrics
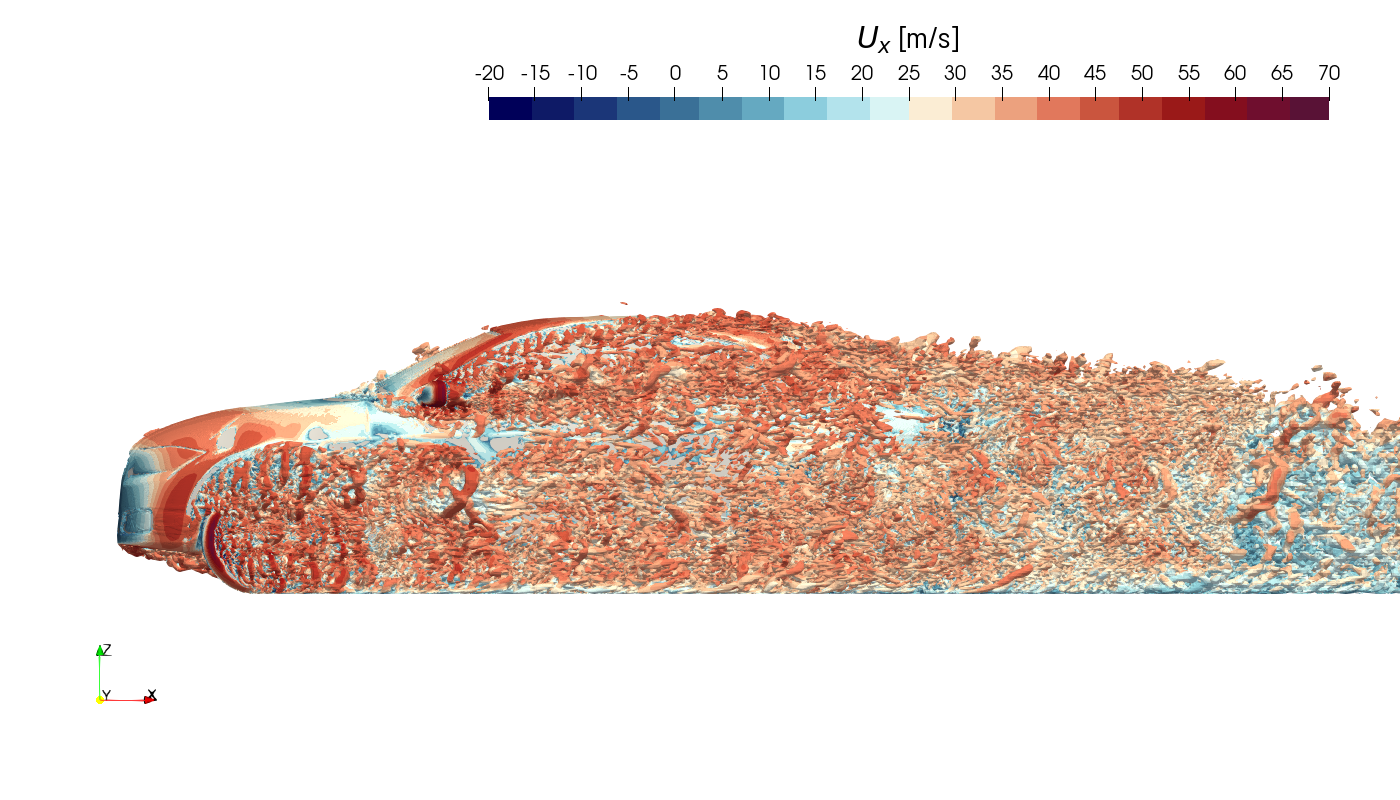
DrivAerML
Open for submissionsDataset, test splits and evaluation metrics
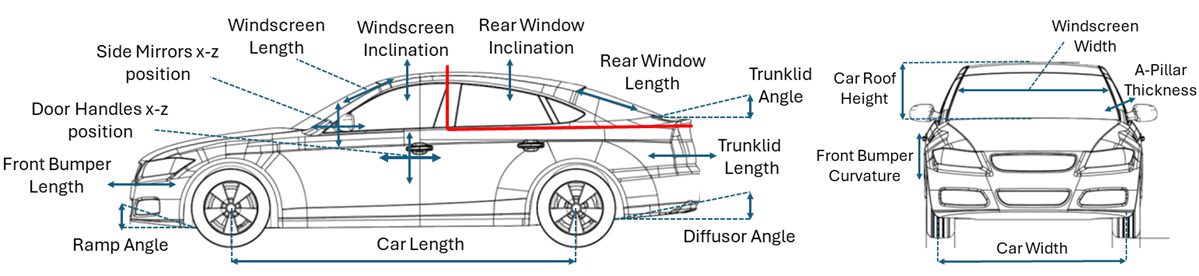
DrivAerNet++
Open for submissionsDataset, test splits and evaluation metrics

AhmedML
Open for submissionsDataset, test splits and evaluation metrics
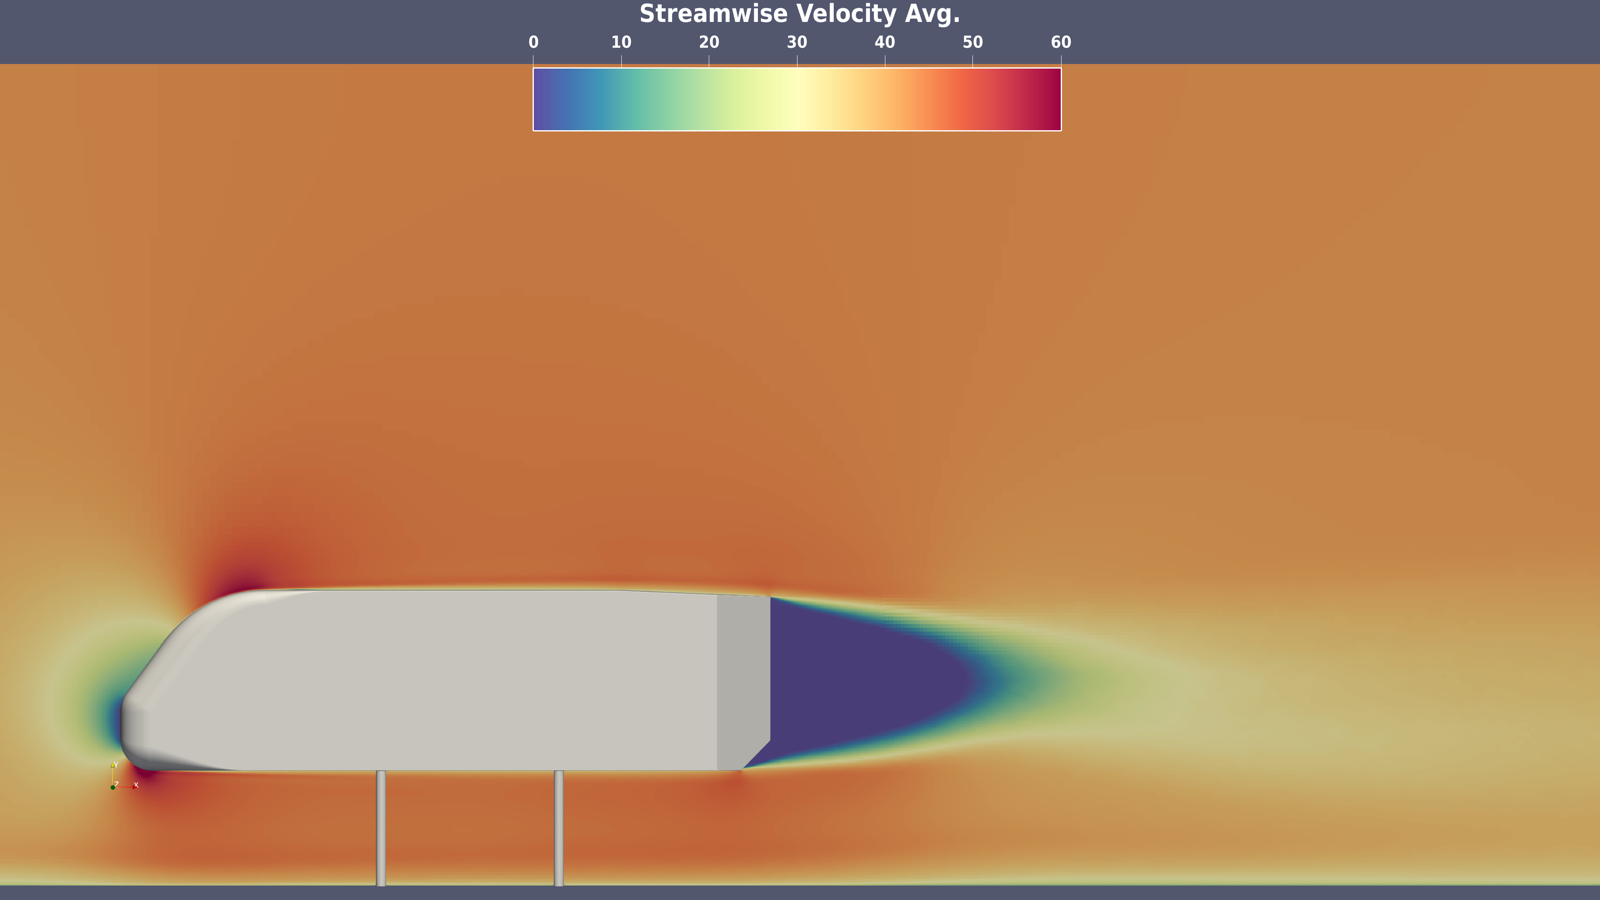
WindsorML
Open for submissionsDataset, test splits and evaluation metrics
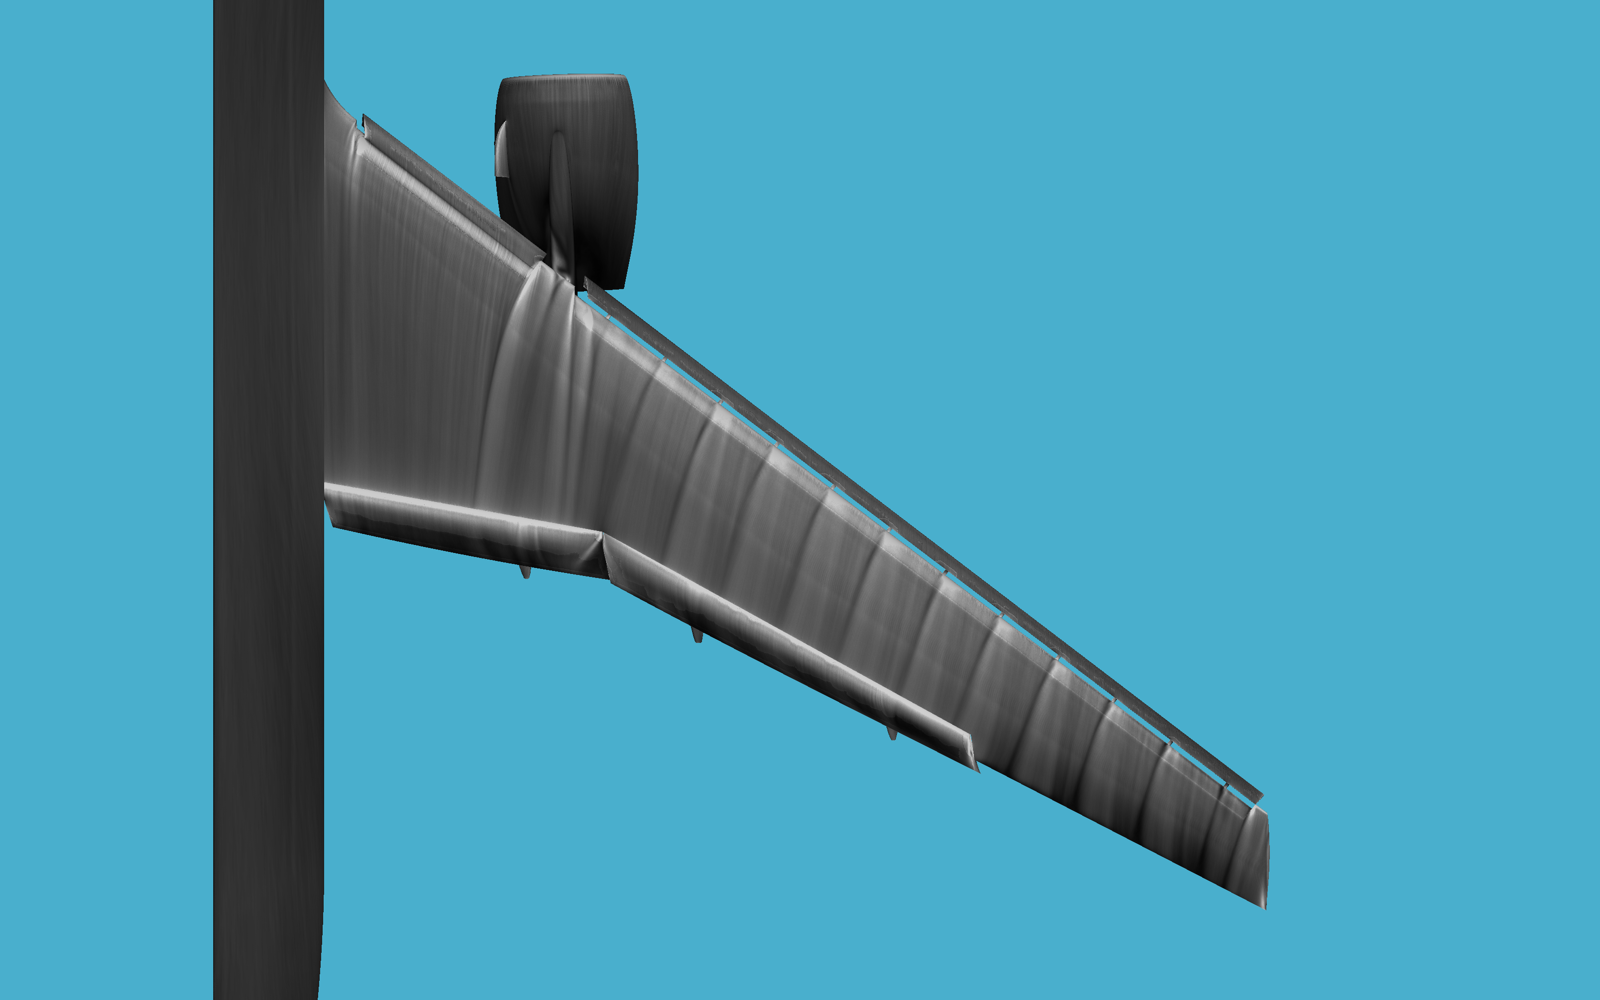
HiLiftAeroML
Coming soon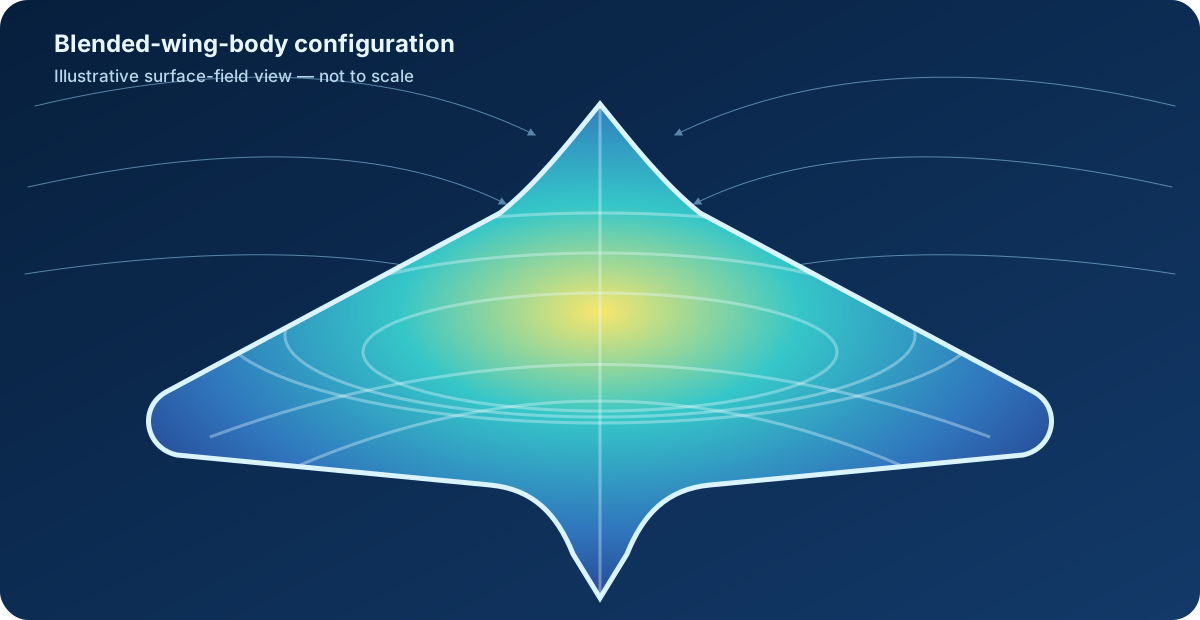
BlendedNet
Coming soon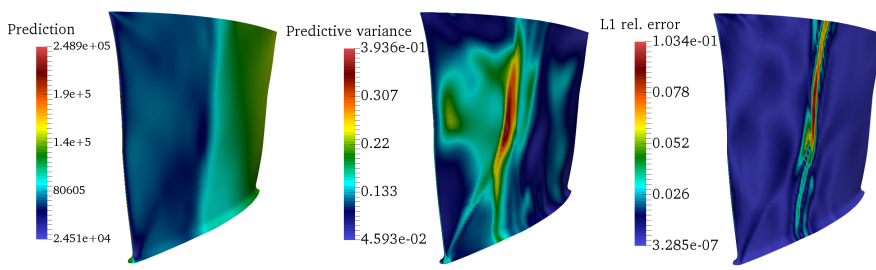
Rotor37
Coming soon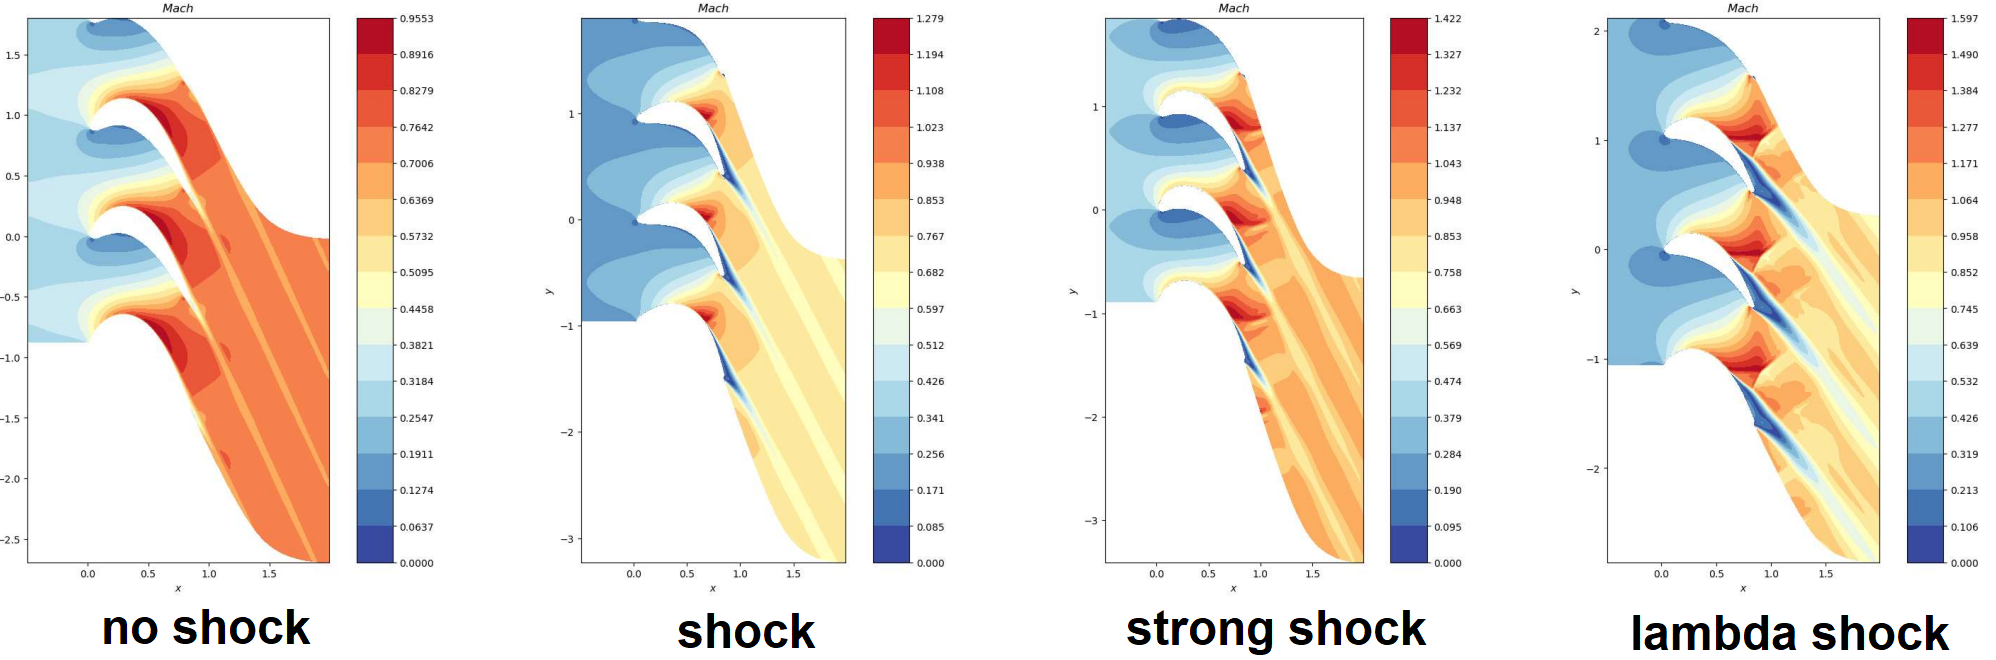
VKI-LS59
Coming soonParticipation
Evaluation and submission
- 1
Choose a dataset
Check its submission status, data and evaluation requirements.
- 2
Evaluate your model
Generate predictions, calculate the metrics and validate your package.
- 3
Submit on GitHub
Open a pull request for an open dataset. Maintainers review it for publication.
Submission information
Frequently asked questions
Questions about your submission?
Talk to the community →
When will I be able to see the results?
The first official leaderboard is planned for 5 December 2026 Anywhere on Earth (UTC−12). It will bring together reviewed submissions received by the first-release cutoff. Submissions continue afterwards, with later results appearing in subsequent releases.
Are submissions confidential before launch?
No. Submissions and their review are public on GitHub. The official website rankings will be published together on the release date.
Do I need to run every dataset?
No. Start with one open dataset and one supported split. Follow that dataset's guide for the complete set of required evaluation cases.
Do I have to publish my model or source code?
Code and model artifacts are optional. Every submission needs the required result package and evaluation evidence. See what FluidsBench validates.